Compiled by Aaron Gantz, Senior Director of Economic Development
In this second annual Mid-Year State of the Economy, GRCA presents a compiled economic snapshot of Berks County. Please note, throughout this report we refer to the area as Berks County which represents Greater Reading — the Reading, PA Metropolitan Statistical Area (MSA).
Key takeaways:
Manufacturing continues to hold the number one spot as both the largest industry sector based on employment and GDP – giving the industry a high location quotient (more on that below!)
Key sectors in Berks’ economy continue to operate with a significantly smaller employee base than prior to the pandemic.
Wages have increased 4.4% in 2022, compared to 9.4% during this same period in 2021
Overall cost of living remains lower than the national average and surrounding metropolitan areas
Consumer spending in Berks County has flattened, while nationally it has continued to rise. The local shift suggests County consumers may be adopting a more conservative stance as inflation continues.
The cost of housing continues to be lower than surrounding communities. Despite lower costs, Berks County continues to be challenged in diverse and desired housing options.
Industries with Largest Employment:
Industries with Highest Earning Potential:
Gross Domestic Product
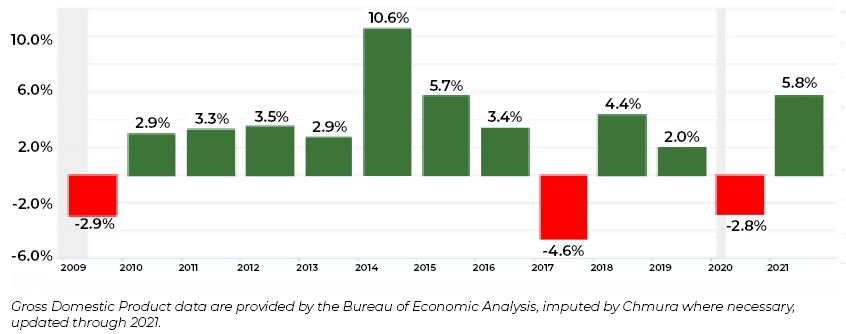
Gross Domestic Product (GDP) is the total value of goods and services produced by a region. In 2021, nominal GDP in Berks County expanded 5.8%. This follows a contraction of 2.8% in 2020. As of 2021, total GDP in was $21,509,460,000.
The Economic Development Company (EDC) of Lancaster County Center for Regional Analysis stated – the second quarter GDP forecasts are varied, signaling uncertainty over how quickly a recession could materialize. The latest estimate from the Atlanta Fed’s GDPNow forecasts negative growth in the second quarter (-1.2%). In contrast, The Conference Board forecasts positive growth (+0.8%), noting that it anticipates the US economy is headed towards a “shallow recession” at the end of the year and into early 2023.
1 year % Change in GDP
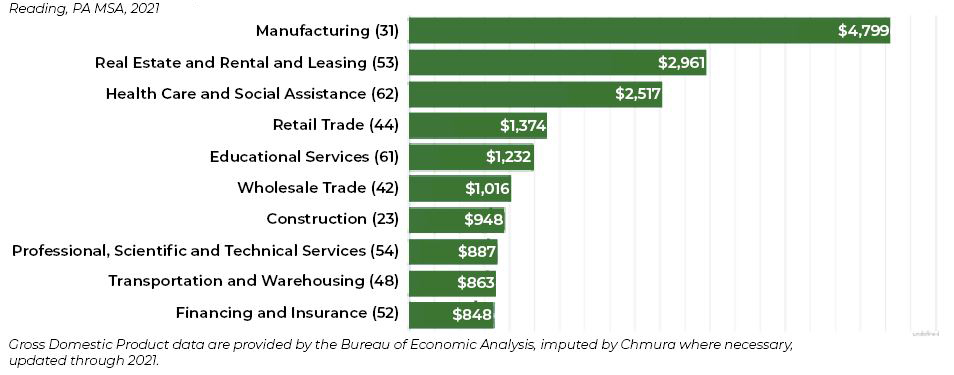
Manufacturing contributed the largest portion of GDP in 2021, $4,799,310,000 – accounting for nearly 20% of Berks County’s economy. The next-largest contributions came from Real Estate and Rental and Leasing $2,960,746,000; Health Care and Social Assistance $2,516,527,000; and Retail Trade $1,373,745,000.
GDP (in $ millions)
Industry Snapshot
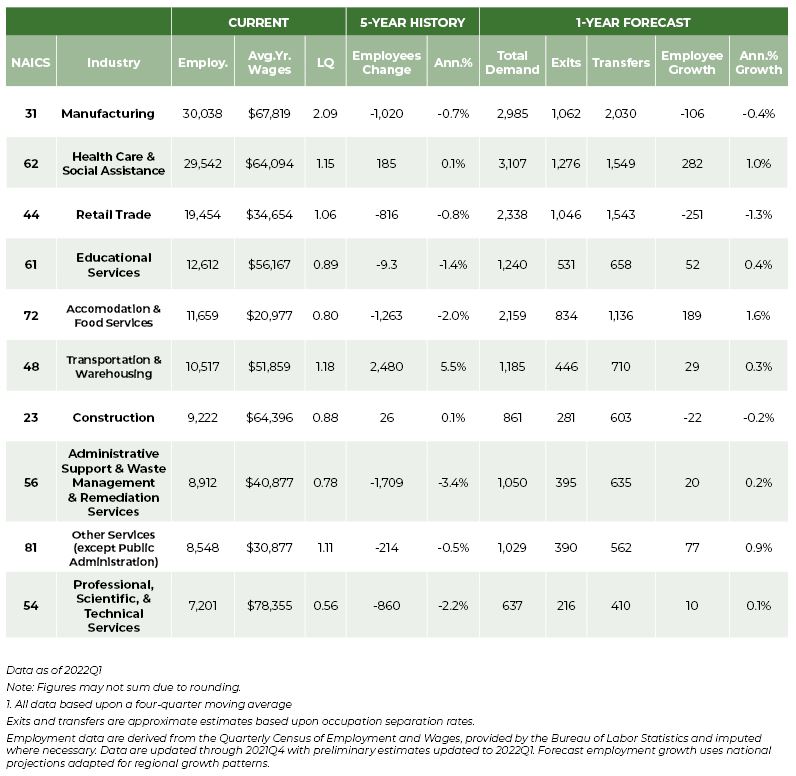
The largest industry sector in Berks County based on both GDP and employment numbers continues to be Manufacturing, employing 30,038 workers. While manufacturing employment numbers are strong, the numbers indicate there are approximately 2,000 fewer workers than in 2019 (prepandemic). This runs counter to other economies in the region where their workforces are at or above 2019 levels. It suggests Berks County businesses may face greater challenges in meeting market demand and preserving productivity.
The next-largest sectors in the region are Health Care and Social Assistance employing 29,542 workers and Retail Trade, employing 19,454 workers. These employment numbers are generally higher than they were in 2021 – Manufacturing and Health Care and Social Assistance trade top place on the number of employees in each sector.*
Location Quotient (LQ) is a measurement of concentration in comparison to the nation. This allows us and others to understand industries and occupations that are unique to our region. An LQ of 1.00 indicates a region has the same concentration of an industry (or occupation) as the nation. An LQ of 2.00 indicates the region has twice the expected employment compared to the nation and an LQ of 0.50 would mean the region has half the expected employment in comparison to the nation.
Manufacturing | LQ 2.09
Electric/Electronics Manufacturing has a location quotient of 4.75. This cluster employs 8,921 workers in the region with an average wage of $71,284. Employment in the cluster is projected to expand in the region about 0.5% per year over the next ten years.
Management of Companies and Enterprises | LQ 1.84
Includes business and financial operations and management with an average annual wage of $115,862
Sectors in Berks County with the highest average wages per worker are:
Management of Companies and Enterprises: $115,862
Utilities: $96,069
Finance and Insurance $91,445
Regional sectors with the best job growth over the last 5 years are:
Transportation and Warehousing: +2,480 jobs
Finance and Insurance: +370
Health Care and Social Assistance: +185
The fastest growing sectors in the region are expected to be:
Arts, Entertainment, and Recreation with a +2.7% year-over-year rate of growth
Health Care and Social Assistance
Accommodation and Food Services
Berks County Top Employers
1. East Penn Manufacturing Company 2. Reading Hospital 3. Amazon.com Services Inc 4. County of Berks 5. Reading School District 6. Carpenter Technology Corporation 7. Wal-Mart Associates Inc 8. Penske Truck Leasing Co LP 9. State Government 10. Tower Health Medical Group
Employment Trends
The overall size of the labor force is rising, but labor supply remains tight. The County’s labor force has generally grown through the first six months, but not at a rate that allows it to catch up to last year (2021). Berks County started the year with 208,180 participants, approximately 5,000 fewer than last year and 7,870 fewer than in 2019 (which is the benchmark for pre-pandemic conditions).
June workforce data indicates employment was at 200,200, representing 3,500 more employed people than at the same time last year.
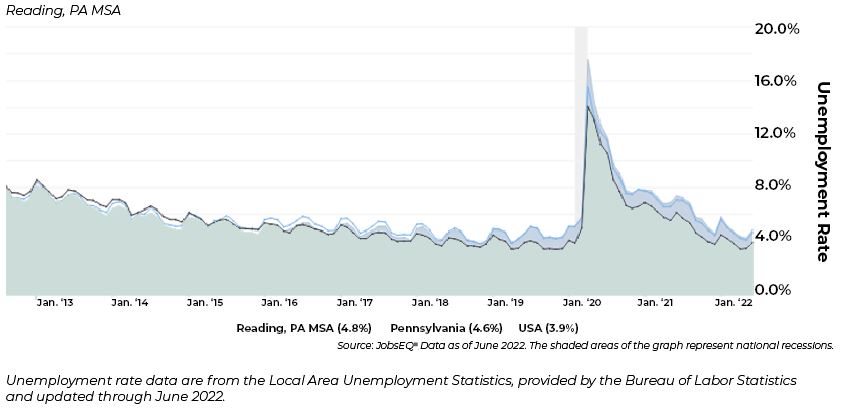
A smaller labor force combined with higher employment levels drove down the unemployment rate (from 5.8% in January to 4.5% in June). This trend reinforces that the County may be at full employment.
Unemployment
Wage Trends
At the start of 2022, we have continued to see and hear from both Berks-based companies and those across the region the need to offer higher wages and invest significant time and resources in recruiting. Many companies are shifting these resources to employee retention efforts through pay increases and training opportunities to advance.
The average worker in Berks County earned annual wages of $56,821 as of quarter 1 2022. Average annual wages per worker increased 4.4%. For comparison purposes, annual average wages increased 9.4% during the same time period in 2021. Additionally, annual average wages were $66,637 in the nation as of quarter 1 2022. Keep in mind, the cost of living in Berks County is below the national average.
Average Annual Wages
Cost of Living Indicators
The GRCA participates in collection of local data for the Cost of Living Index (COLI) compiled on a quarterly basis by the Council for Community and Economic Research (C2ER)*. C2ER uses over 60 carefully selected goods and services across six weighted categories – each of which contribute to the composite index or the area’s cost of living number. The weighted categories are as follows:
Groceries: 13.4%
Housing: 28.0%
Utilities: 10.3%
Transportation: 11.1%
Healthcare: 4.0%
Miscellaneous good and services: 32.8%
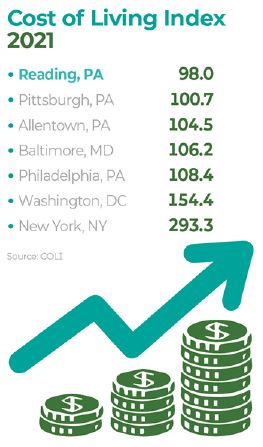
Anything below 100 is considered more affordable than average. Year over year, the COLI for Berks County has remained under 100 – coming in at 98.0 in 2021. For comparison, the Commonwealth of Pennsylvania is 102.5 and the national average is 100.0.
Cost of Living per C2ER, data as of 2021 – 2022 data will be available in October 2022.
Consumer Spending
Consumer sentiment is an important economic measure because consumer spending accounts for nearly 70% of the GDP. It is often viewed as a leading indicator because it signals how consumers may change their spending in response to their current conditions and future expectations.
In the Economic Development Company (EDC) of Lancaster County Center for Regional Analysis’ July report it was stated that inflation and gas prices were top of mind for consumers. Researchers at the University of Michigan, responsible for the national measure of consumer sentiment, reported that households’ assessment of their personal financial condition worsened by 20% in June. 47% named inflation as a key factor in lowering their standard of living. Consistent with this assessment, consumer spending in Berks County appears to have leveled off. Based on data from tracktherecovery.org, consumer spending has hovered around 20% above 2019 levels for several months, halting its upward trajectory.
Housing
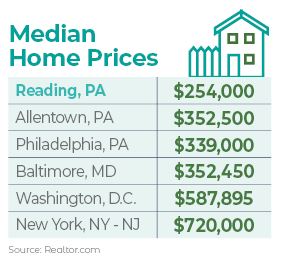
While housing is affordable in Berks County, there is both not enough desired or diverse housing options to meet current and projected demand.
Housing costs — When the median income level is divided by the median home value by county, data shows housing is more affordable in Berks County than the surrounding counties throughout the southeast region of Pennsylvania. In the past year, the median purchase price for a Berks County home was $54k – $200k less than homes in neighboring counties. Young professionals and other first-time buyers can transition into homeownership despite the competitive real estate market.
All of this data adds up and as a result, Greater Reading has earned top spots in the U.S. News & World Report’s Best Places to Live 2022-23 rankings –
FAQ
What is a location quotient? A location quotient (LQ) is a measurement of concentration in comparison to the nation. An LQ of 1.00 indicates a region has the same concentration of an industry (or occupation) as the nation. An LQ of 2.00 would mean the region has twice the expected employment compared to the nation and an LQ of 0.50 would mean the region has half the expected employment in comparison to the nation.
What is NAICS? The North American Industry Classification System (NAICS) is used to classify business establishments according to the type of economic activity. The NAICS Code comprises six levels, from the “all industry” level to the 6-digit level. The first two digits define the top-level category, known as the “sector,” which is the level examined in this report.
What is SOC? The Standard Occupational Classification system (SOC) is used to classify workers into occupational categories. All workers are classified into one of over 804 occupations according to their occupational definition. To facilitate classification, occupations are combined to form 22 major groups, 95 minor groups, and 452 occupation groups. Each occupation group includes detailed occupations requiring similar job duties, skills, education, or experience.
About This Report
This report and all data herein were compiled by the Greater Reading Chamber Alliance using a variety of sources — JobsEQ®, a product of Chmura Economics & Analytics, the Reading Berks Association of Realtors and the State of the Economy Report by the Lancaster Economic Development Company’s Center for Regional Analysis commissoned by the Berks County Workforce Development Board. The information contained herein was obtained from sources we believe to be reliable. However, we cannot guarantee its accuracy and completeness.